Redistricting Studies
Making the decision to redistrict is one of the most difficult tasks facing a school district. It is essential that all alternative solutions to redistricting be explored before making changes to the attendance zones for the schools and/or closing a particular school building. To that end we can offer a two level approach. The first is recognition that it is essential to promote good communications between the District and its constituent community. Through its experiences with many school districts during the past 20 years RHA can share techniques and methods that will result in fair and equitable solutions.
The first recommendation is that the plan to redistrict, once the decision is made, is done well in advance of the target date. We recommend that the planning begin at least one year in advance of the planned change. It is also essential that the Board of Education and administration be transparent with the community. Any plans must be presented publicly and the community should be given the chance to provide input. While our experience has shown that there will be some in the community who will view any change negatively it is important that the Board demonstrates how the change will benefit students (lower class size, better ways to offer programs and services, etc.). During the process the Board should use its website to keep the community updated and both the Board and administration should be open to valid criticism from the community.
There are two essentials to redistricting. The first is that the data used in the process is accurate. The second, which follows the first is that the community must know that the redistricting, barring any unforeseen circumstance, will hold up for a minimum of five years. To that end we employ state of the art technology by using Geographic Information (GIS) Systems. GIS provides accurate analysis of attendance areas by having the location of the schools, attendance areas, and students located on the map of the district. From that many scenarios can be developed and analyzed. In addition, because of the visual nature of GIS it provides an excellent means of involving the community. Data can be shared at public meetings and on the District website.
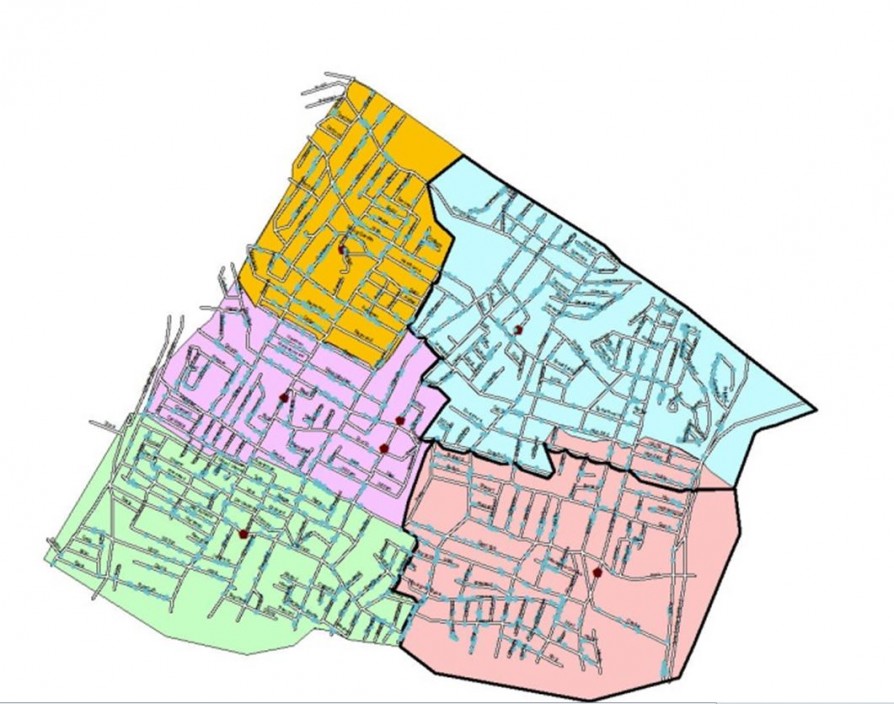
The picture below is an example of five elementary attendance zones with schools and students
located on the map. The black line represents one area of change. The number of students residing in that area can be counted by grade and/or any other data base criteria.